ANNOUNCEMENTS:

I'm back after a sabbatical !

SUBSCRIBE Centaur Investing's Newsletter

Wednesday, November 3, 2010

Ashok Leyland : Resistance @ Rs. 77


ASHOK LEYLAND Daily NSE Stock Chart Technical Analysis:


Ashok Leyland is moving within a price channel as was discussed in my 22 Oct blog post.  Also as was observed in that post, the price has continued to hug its 50 day moving average.


Today the market closed at 75.3, a fall from the opening price of 76.25.


Market Outlook:  The market close lower tomorrow.  After that, it will try and recover its 50 day moving average.


Technical Indicators:

  • The blue dot shows a point where the price will have to make a final decision to break out of its Rs 70 resistance line.  This will happen in the 4th week of Nov '10.  
  • If market remains above Rs. 70 for 2-3 consecutive days, then based on other positive factors, a long position can be entered into.

Dabur: Head & Shoulders vs Support Line


DABUR INDIA Daily NSE Stock Chart Technical Analysis:

This may look like a complicated chart, so don't rush through the explanation.

Dabur closed at 99.35 today after opening at 100.25.  The price has been sideways for 4 days now after a big fall on 28 Oct '10.

Market Outlook:  The price will remain sideways in the next 2-3 days.  No trade signal.

In the meantime, it will find support near Rs 99 price level.  

If this breaks, the next support is at Rs 96.5.

Technical Indicators:
  • The chart has formed a head and shoulders pattern.
  • The short term moving average has pierced the long term moving average from above.  
  • The price is quite below even its 100 day moving average.
  • There is a 1-year old support trend line which has recently given support to the falling price at Rs 98.25 as seen on the chart.  This line will extend support @ Rs. 99 levels in the next 3-4 days.  The breach of this line downwards could be dangerous.
  • There is another point of support around Rs 96.  If this too is broken, a downtrend is imminent.  


Dabur: Head & Shoulders vs Support Line


DABUR INDIA Daily NSE Stock Chart Technical Analysis:

This may look like a complicated chart, so don't rush through the explanation.

Dabur closed at 99.35 today after opening at 100.25.  The price has been sideways for 4 days now after a big fall on 28 Oct '10.

Market Outlook:  The price will remain sideways in the next 2-3 days.  No trade signal.

In the meantime, it will find support near Rs 99 price level.  

If this breaks, the next support is at Rs 96.5.

Technical Indicators:


The chart has formed a head and shoulders pattern.


The short term moving average has pierced the long term moving average from above.  


The price is quite below even its 100 day moving average.


There is a 1-year old support trend line which has recently given support to the falling price at Rs 98.25 as seen on the chart.  This line will extend support @ Rs. 99 levels in the next 3-4 days.  The breach of this line downwards could be dangerous.


There is another point of support around Rs 96.  If this too is broken, a downtrend is imminent.  

Kinetic Motors - New Line of Support


KINETIC MOTORS Daily NSE Stock Chart Technical Analysis:

Kinetic Motors has found a new line of support - the same diagonal which was acting as a line of resistance.

The price closed today at Rs 38.2 after opening at 40.8 and both open and close stayed close to yesterday's levels.

Market Outlook: The price on Thu should remain between Rs 36 and Rs 42.

Technical Indicators:
  • The 20 day moving average has gone above the price and stayed there since 5 days, which is a slowdown sign.

  • The interest in the stock has also slowed down at this price level.  A sudden push in either direction may happen soon.  

Hero Honda Rises Today, Could Fall Back Soon


Hero Honda Daily NSE Stock Chart Technical Analysis:

Hero Honda is taking Fibonacci levels support and closed at the 61.8% level today after opening at 50%.  In price terms, it closed at Rs 1867.65 after opening at Rs 1853.

Market Outlook:  The price will find resistance near today's close and fall back again the day after.

Technical Indicators:
  • The price is trying to take support of the Fibonacci retracements as mentioned above.
  • The interest in the stock at this price level seems unsustainable and the price should fall back very soon.  Today's price spurt seems to be an attempt to drive the prices higher but no one in the market seems convinced with today's rate.

Reliance Industries Continues to Fall, Reaches Support Line


Reliance Industries Daily Stock Chart Technical Analysis:

As analyzed in my post on 1 Nov 2010, Reliance Industries fell for 2 days and found support at 1065 today.

Market Outlook:  The price could fall further on 4 Nov '10 but will rally back and try to close above 1069.  It is worrisome if the price does not close above this level tomorrow.

Rs 1142 is an important long-term level of resistance if the price continues in uptrend.  If the stock is able to cross Rs 1142, the next decisive moment will come around 1200-1250 levels.  

Technical Indicators:
  • A price channel has formed and the stock price is playing well within it.
  • Rs. 1142 is a long term line of resistance.  The price has not been able to cross it even after 4 attempts during different times in the last year.

3i Infotech Resistance at Rs 70


3i Infotech Daily NSE Stock Chart Technical Analysis:


3i Infotech on NSE maintained its line of resistance at Rs 70 and fell throughout the day to close at 67.05.  The support for this fall is found at Rs 65 and Rs 66.


Market Outlook: The price could fall further tomorrow and test the support levels of 66 and 65.  If Rs 65 is broken and the price falls below that, it could lead to a downtrend.


Technical Indicators:


Rs 65 is a long term support line and 3i price has repeatedly found support on this line in the past 2 years, which makes it a very important level to watch.


Rs 65 is also the 61.8% level for the current Fibonacci Retracements, which makes it even more important right now.

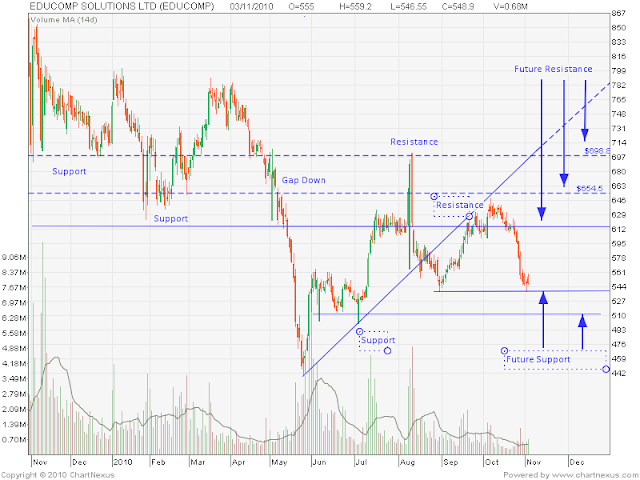
Educomp Solutions U-turns After Long Fall


EDUCOMP SOLUTIONS Daily NSE Stock Chart Technical Analysis


Educomp Solutions Ltd on NSE made a U-turn today after 3 weeks of downfall.  


The price opened at 555 and closed at 548.9.  Though the price closed lower than its open, it closed above yesterday's intraday low, which also comes as a welcome sign at this point.


Market Outlook:  The price should begin going up again, but wait a couple of days for confirmation before buying.  Points of resistance will be at 614, 654 and 700.  The points of support in case the price falls will be at 550 and 540.  


Technical Indicators:

  • The downfall slowed down and turned after strong high volume falling, this seems to be an exhaustion.  


  • The price makes a double bottom at 548.  This also happens to be the Fibonacci 50% support level.


  • This long term view of the chart is a classic example of resistance turning into support and vice-versa.

Popular Posts

Connect With Me

Site Popularity

Follow Me on Twitter