ANNOUNCEMENTS:

I'm back after a sabbatical !

SUBSCRIBE Centaur Investing's Newsletter
Showing posts with label Trendline Break. Show all posts

Sunday, September 14, 2014

NIFTY Had An Indecisive Week (14 Sep 2014)


NIFTY Weekly Market Index Chart Analysis

The market fell a minor 0.33% this week, and sustained the support line.  However, it is too close to the support line for us to be relaxed.

The weekly candlestick is not a perfect Doji, but it does resemble a Doji.  This is a signal of confusion in an upward trending market.  Volume has risen during the week but range of market movement was relatively small.  The market seems to be gearing up for a bigger move.

Notably, over the past 17 weeks (4 months), the 14-week RSI is forming a bearish divergence to the NIFTY.  This needs to be watched closely, as either the RSI will rise and match NIFTY; or NIFTY will fall and match the RSI.  The divergence has sustained for quite a while now!

All posts related to NIFTY

NIFTY Weekly Market Index Chart Analysis

Tuesday, July 12, 2011

NIFTY Falls Below Support: July 12


NIFTY Daily Technical Chart Analysis:

NIFTY fell below a significant support line at the 5600-5610 levels today.  The market opened gap-down and recovered slightly only towards the end of the trading session.

Since Feb 2011, the 5610 levels have displayed strong resistance, with only occasional spurts above this limit during the past 5-6 months.  Once again the market has fallen below this level and so there might be a tendency to fall further.  The index is expected to be turbulent over the coming few days.  Until it goes about 5610, avoid taking any long positions on NIFTY.


NIFTY Daily Technical Chart Analysis

Thursday, March 31, 2011

Reliance Communications: Falling Again ?


RELIANCE COMMUNICATIONS Daily NSE Stock Chart Technical Analysis:


Close & CMP: 107.65

  • Reliance Communications faced resistance near the Ichimoku Cloud at 108 as expected, and is now falling back and has broken its support trendline.  The momentum has also peaked and the volume has fallen.
  • No long positions should be entered at this point.  Only enter short term positions with small time window of liquidating the position.
  • Think of buying only if it rises above 118.
  • Reliance Communications अब गिर रहा है और सुप्पोर्ट ट्रेंड लाइन के नीचे भी गिर गया है.  अभी इसे खरीदा नहीं जा सकता है, सिर्फ शोर्ट पोसिशन लें.  अगर ११८ के ऊपर जाता है तो ही खरीदने के बारे में सोचें.  


All posts related to Reliance Communications


RELIANCE COMMUNICATIONS Daily NSE Stock Chart Technical Analysis


Thursday, January 20, 2011

Reliance Communications: Upward Journey Begins


RELIANCE COMMUNICATIONS Daily NSE Stock Chart Technical Analysis:

Reliance Communications rose today and climbed back above its support line.

Close & CMP: 133.4

Market Outlook:
  • The price seems to be headed upwards again.  There is an opportunity to buy.

Technical Indicators:
  • A marabozu candle formed today
  • The price climbed back above its support line at 132.50.
  • A lot of people participated in rallying the price above its support line, almost twice as much trading happened today as compared to yesterday.
  • The price is deeply oversold.
  • There was a gap-down 4 days ago.  This seems like an exhaustion gap and the price could be ready to move up again.
  • Rising above 137.5 will be a good signal.


RELIANCE COMMUNICATIONS Daily NSE Stock Chart Technical Analysis

Granules India: Finally Showing Hope


GRANULES INDIA Daily NSE Stock Chart Technical Analysis:

Granules India continued its upward journey for the 5th trading session today, which is a good sign in this otherwise falling market.

Close & CMP: 93.60

Market Outlook:
  • Granules India has crossed over its resistance today, which was at 93.  This is a very positive signal and if it remains above 93 for the next day or two, it might give a buy signal.

Technical Indicators:
  • After falling below the support, the price came back above its support today.  This is a positive indicator.
  • The volume for today is also good compared to the past few trading sessions.
  • The price made a spinning top candlestick today.  This is the only point of concern in an otherwise positive looking chart.  The spinning top on such a day means the bears are not inactive on Granules India yet, and there could be an attempt to pull the stock price down again.
  • The next couple of days should give us a final idea of where GI is headed, and if we should take a long position on it.


GRANULES INDIA Daily NSE Stock Chart Technical Analysis

Thursday, December 30, 2010

Apollo Tyres: Breaks Resistance


APOLLO TYRES Daily NSE Stock Chart Technical Analysis:


Apollo Tyres closed at 65.85, above its resistance.

Market Outlook:

  • Breaking of the resistance is a bullish signal. There is an opportunity to buy with a quick intraday target of 70.

Technical Indicators:

  • The breakout may find problem in sustaining considering the low qty of trading during the day.
  • 70 is an important level to cross tomorrow.  
  • The monthly chart (not shown here) tells us that closing above 70 will be a real bullish indicator.
  • If December does not close above 70, I would be doubtful about a rise in Apollo's share price.


APOLLO TYRES Daily NSE Stock Chart Technical Analysis

Sterlite Techno: Bullish Breakout


STERLITE TECHNO Daily NSE Stock Chart Technical Analysis:


Sterlite Techno closed at 74, about 2.77% above its resistance which is @72.

  • This is a bullish signal and can be traded with first target @ 79-81 and SL at 70. 
  • If price breaks above 82, it is a very good signal  But falling below 72 is negative.
  • For recent detailed analysis of Sterlite Techno, click here


STERLITE TECHNO Daily NSE Stock Chart Technical Analysis

NIFTY: Breakout Today


NIFTY Daily Chart Technical Analysis:


NIFTY climbed up for the 3rd successive day today, and closed at 6102.

Market Outlook:

  • NIFTY can be expected to continue an upward movement, though it could continue to move slowly.
  • Falling below 6080 will be viewed as a bearish signal, and yes, there is a small chance of falling below the resistance tomorrow.

Technical Indicators:

  • The index broke through a resistance level today and closed above it.
  • The movement was upwards almost through the entire day.
  • The only concern is the low volume, much lower than average.

All previous posts about NIFTY


NIFTY Daily Chart Technical Analysis

Sunday, November 14, 2010

Reliance Industries Weekly: 8-12 Nov 10: Faces Resistance, Breaks short term support


RELIANCE INDUSTRIES Weekly NSE Stock Chart Technical Analysis:

The week saw a fall throughout, opening at 1113.9 and closing at CMP 1061.85 (a fall of 52.05)

Market Outlook:

  • The next week seems like it is set to fall further.  Next support is near Rs 966.
  • Possible buy near 966-970.

Technical Indicators:

  • Decision point 1 ended negatively as the stock price could not break through resistance. 
  • Price fell through a short term line of support which was created since mid-August.
  • The resistance at 1119 was too strong for the stock price to break through and it returned from 1113.9.
  • With short term support broken, we will have to depend on the support between 961 to 970 to stop the price from falling further.  It might take another 2 weeks to fall and reach this support level.


RELIANCE INDUSTRIES Weekly NSE Stock Chart Technical Analysis

Wednesday, November 3, 2010

Kinetic Motors - New Line of Support


KINETIC MOTORS Daily NSE Stock Chart Technical Analysis:

Kinetic Motors has found a new line of support - the same diagonal which was acting as a line of resistance.

The price closed today at Rs 38.2 after opening at 40.8 and both open and close stayed close to yesterday's levels.

Market Outlook: The price on Thu should remain between Rs 36 and Rs 42.

Technical Indicators:
  • The 20 day moving average has gone above the price and stayed there since 5 days, which is a slowdown sign.

  • The interest in the stock has also slowed down at this price level.  A sudden push in either direction may happen soon.  

Thursday, October 21, 2010

Bajaj Finance Finds Short term Price Channel Support


Bajaj Finance stock on NSE fell below its long term support line 4 days ago, but has found support on the horizontal line.  I have talked about all the lines in my previous posts on Bajaj Finance, pl refer to them for this thread of discussion.

We will wait and watch before taking any position, but it does seems like the stock will fall further based on the negative candlestick formations and some other indicators.


Chart Source: www.moneycontrol.com

IDBI Sideways but Breaks Through Double Top


Yes! IDBI Bank stock on NSE has finally broken its double top.  Combined with other indicators, it suggests a slow and steady upward rise.  This might be too soon to take a position, but we should get a confirmation within a couple of days whether to take a position. 

Chart Source: www.moneycontrol.com

Monday, October 18, 2010

Bajaj Finance Breaks Support Trendline


Bajaj Finance stock on NSE has broken its long-term support trendline instead of breaking its short term upper price channel, as was discussed in yesterday's post .

There is still another level in the horizontal channel to be achieved.

If that is breached, the next stop could be at the lower diagonal trendline. The other indicators are also pointing at further fall in price.

I'm willing to go short tomorrow, if the price falls and remains below the lower horizontal line.

Chart Source: in.reuters.com

Sunday, October 17, 2010


Tata Steel broke its month-old trend line on 7-Oct.  But since, it seems to have found a new support line as is visible above.


Redrawing trends on the same chart, Tata Steel seems to have not found a new support line, but has found support from a trendline retraced to a 4.5 month old level.  I am willing to believe that this stock will sustain and rise in the coming days, and that the current fall could just be a simple attempt at short-term correction.  Hmm.. 

Monday, October 11, 2010

Airtel falling below in Price Channel


Airtel has just breached its 4-month support line and price channel.  The stock is oversold and may bounce back.  If market continues to go downwards it's time to tighten your stoploss if you have not already done so.
Keep an eye on the stochastics movement for clues.  Doji formation on 11th shows some resistance to the stock in moving further downwards.

Chart Source: in.reuters.com, www.moneycontrol.com

Tuesday, October 5, 2010

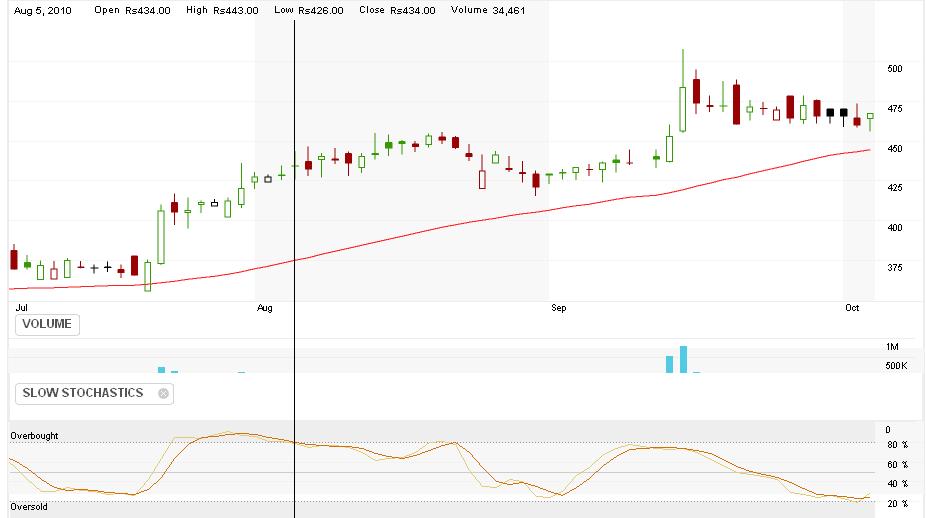
Ingersoll Rand Breaches Support Trendline


Stock has walked out of its two month trend support.  It is walking sideways – showing undecidedness.  

The trading volume is very low as well.  

The stochastics is trading below midzone, hence there might be some purchasing soon.  The last formation is a weak hammer.  The stock is trying to gain support but facing resistance at the same time.  Have to wait and watch.

Indraprastha Gas breaches 3-month support line


Market has broken its 3 month trendline in September , is now sideways.

Morning star pattern has formed recently, and stochastics are also medium.  The stock could rise again and continue upward movement.

Popular Posts

Connect With Me

Site Popularity

Follow Me on Twitter