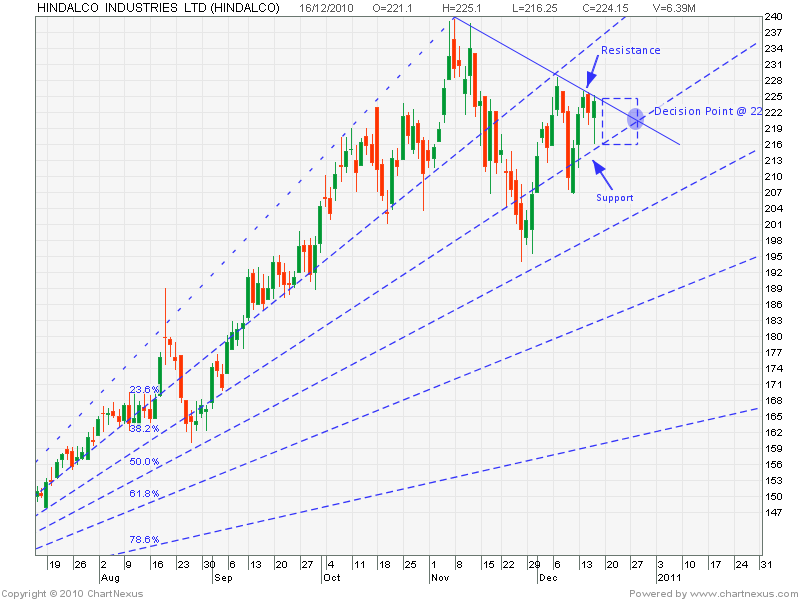
HINDALCO Daily NSE Stock Chart Technical Analysis:
Hindalco fell during the first half, but a late rally saw it close higher, close to its intraday high.
Open: 221 Intraday Low: 216 Close & CMP: 224
Market Outlook:
- The price could remain range bound, between 216 and 225.
- As of today, there is no trade signal on this stock.
- Opportunity to go long above 225, and go short below 216.
Technical Indicators:
- A short-term line of resistance has developed as visible on the chart.
- The Fibonacci fan 38.2% is acting as a natural level of support for Hindalco stock price.
- 221 is a decision price point near end of December, the stock price either will break its resistance or support at this price.
- Trade breakouts if occur beyond the price range of 216-225.
HINDALCO Daily NSE Stock Chart Technical Analysis


