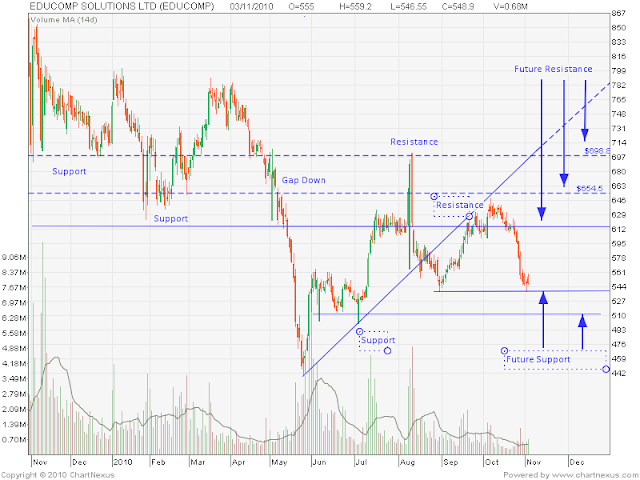
EDUCOMP SOLUTIONS Daily NSE Stock Chart Technical Analysis
Educomp Solutions Ltd on NSE made a U-turn today after 3 weeks of downfall.
The price opened at 555 and closed at 548.9. Though the price closed lower than its open, it closed above yesterday's intraday low, which also comes as a welcome sign at this point.
Market Outlook: The price should begin going up again, but wait a couple of days for confirmation before buying. Points of resistance will be at 614, 654 and 700. The points of support in case the price falls will be at 550 and 540.
Technical Indicators:
- The downfall slowed down and turned after strong high volume falling, this seems to be an exhaustion.
- The price makes a double bottom at 548. This also happens to be the Fibonacci 50% support level.
- This long term view of the chart is a classic example of resistance turning into support and vice-versa.


Thank you for the analysis.
ReplyDeleteGood analysis. But the fall is still on the cards. The results are on 12th Nov. So I think one more week it will keep falling and will bring the stock near to 500.
ReplyDelete