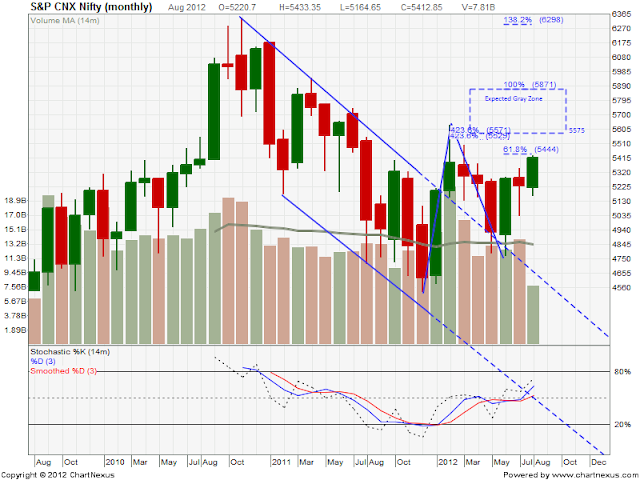
NIFTY Monthly Chart Technical Analysis
(Each candlestick represents one month of movement)
NIFTY seems to be consolidating over the past few months, moving within a set range horizontally.
The momentum stochastics is showing a cup formation since Aug 2010, and could to cross above the 80% line.
It seems that NIFTY will rise into the gray zone, between 5575 and 5871. I am calling this the gray zone as one NIFTY reaches here, we would have to study the market very closely to watch out for any signals for the market to move upwards or downwards. Until then the market should seemingly continue in consolidation mode.
All posts related to NIFTY
NIFTY Monthly Chart Technical Analysis


