ANNOUNCEMENTS:

I'm back after a sabbatical !

SUBSCRIBE Centaur Investing's Newsletter

Wednesday, December 26, 2012

NIFTY: Nothing Significant Today


NIFTY Daily Chart Technical Analysis
(Each candlestick represents one daily of stock market activity)

NIFTY closed +50 today and displayed an upward marabozu candle with decent volume, but it still is below the resistance line at 5950.

That is the level to watch out for.  

If it hits 5950, then that would be a good time to play short if the volume lowers and the bar turns red the next day.  But in case it goes above 5950, look for the intensity of the breakout before taking a long position in the market


NIFTY Daily Chart Technical Analysis


Tuesday, December 25, 2012

NIFTY Triangle Upto 5950


NIFTY Daily Chart Technical Analysis
(Each candlestick represents one daily of stock market activity)

NIFTY has hit its old resistance around 5950, a resistance level it had encountered back in April 2011.

As we can see on the chart, NIFTY is now climbing in a triangle considering its steep support line and its current resistance.  The chart denotes lateral movement within the triangle until Feb 2013.

Lets see if that is how it goes. 

In case NIFTY breaks the triangle upwards or downwards with increasing volume it would be a good time to take long (on upward break) or short positions (on downward break).


NIFTY Daily Chart Technical Analysis

Monday, September 17, 2012

NIFTY in 'Grey Zone'


NIFTY Daily Chart Technical Analysis
(Each candlestick represents one daily of stock market activity)

On Aug 23, I posted that NIFTY is expected to rise above 5575.  The resistance is near 5871.  Currently, the NIFTY is into this zone.  This rise is primarily due to the bank rate revision as well as approval of higher FDI in various important sectors of Indian economy.  However, it was as if the candlestick chart aided by some Fibonacci tracing and momentum indicators, was showing an expectation of rise above 5575 much before the govt. declared policy changes.  Somehow, as if, the chart knew!

Today, we can see that NIFTY saw heavy trading and a small fall during the day, indicating that long positions were being liquidated in large numbers.  This, couple with a previous resistance at the same level, could mean that the market might see some more horizontal movement or further fall from this level tomorrow.

Also, two sudden gap ups with increased trading could be some sort of a 'bear trap' - the jump before the fall.  Avoid getting too excited at the moment about the index jumps.


NIFTY Daily Chart Technical Analysis

Thursday, August 23, 2012

Could NIFTY Rise Further?


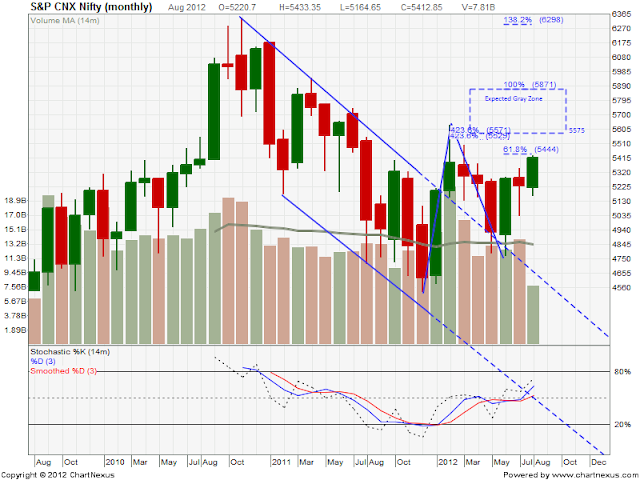
NIFTY Monthly Chart Technical Analysis
(Each candlestick represents one month of movement)

NIFTY seems to be consolidating over the past few months, moving within a set range horizontally.

The momentum stochastics is showing a cup formation since Aug 2010, and could to cross above the 80% line.

It seems that NIFTY will rise into the gray zone, between 5575 and 5871.  I am calling this the gray zone as one NIFTY reaches here, we would have to study the market very closely to watch out for any signals for the market to move upwards or downwards.  Until then the market should seemingly continue in consolidation mode.


All posts related to NIFTY


NIFTY Monthly Chart Technical Analysis

Popular Posts

Connect With Me

Site Popularity

Follow Me on Twitter