ANNOUNCEMENTS:

I'm back after a sabbatical !

SUBSCRIBE Centaur Investing's Newsletter

Thursday, October 28, 2010

Bajaj Auto cruising comfortably on the 50-day moving average


Bajaj Auto stock on BSE is rising comfortably on its 50 day moving average since December 2009.

The current volume suggests that as the price is falling towards its 50 day moving average, the trading has decreased.  Ideally, this should pick up again in a day or two, on or before reaching the 50 day moving average.


A closer look at the chart shows that each swing from the 50 day moving average is about 125-250 rupees upwards.  So, as the price moves upwards again before or on touching the 50 day moving average, this stock can be bought with a target to profit between 125 and 250 rupees.

However, the current chart also shows a bunch of negative candles since the past 3 weeks.  The trend overall seems positive but the appearance of this bunch of candles is not a pretty sign. Book short term swing profits on this stock, not a good time to go "too" long.

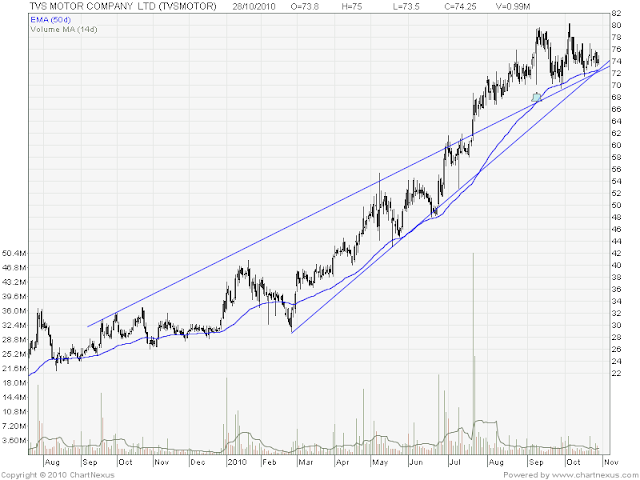
3 lines of support converge on TVS stock chart


TVS Motor stock price on NSE has seen 3 support lines converge yesterday, of which one is its 50 day moving average.  Which of these support lines will the TVS stock adhere to?  That's what is to be seen before  taking the next position on this stock.


This is a closer view of the support lines converging.  The 50 day moving average (not seen in 2nd chart) touches the line of support today.  The 20 day moving average (not seen here) is closing back in to the 50 day moving average, showing that some consensus is building in the market and this consensus should be visible soon from which line of support remains valid.


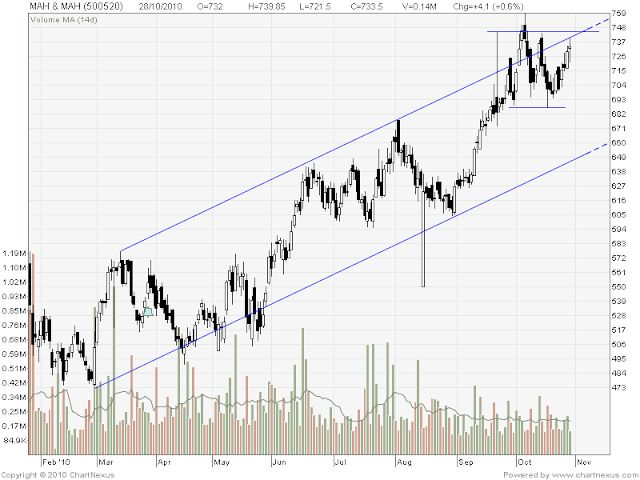
Mahindra & Mahindra (M&M) Scooters stock price on NSE is in a price channel since Mar 2010. The price tried to break out of this channel on 5th and 6th October but could not do so and fell back into the price channel.  

Today's high is close to the upper limit of the price channel, but the stock closed lower than its high so the price may rise tomorrow atleast in the first session.

What happens after the price hits the resistance of the price channel is important to watch.


A closer look at today's chart shows an indecisive market.  Also, double tops have formed previously at 744 and double bottoms have formed at 688.  Breaking either of these levels after an indecision day can signal the next move in the market.  Wait and watch.

Kinetic Motors Sideways


My earlier post on Kinetic Motors on Oct 22nd 2010 speculated on a possibility of price rise based on confirmation.  But the confirmation never came and the market developed a sideway trend.  

Three moving averages have diverged to a large extent, and volume has also slowed down.  The market should remain sideways tomorrow as well.


An yearly view on the chart shows how divergent the moving averages have become, denoting mixed emotions about this stock amongst investors and continuation of choppy sideways market with some more black / neutral candles for the time being.  

Hero Honda takes support of 250 day moving average


Hero Honda Motors stock price on NSE is currently sideways and closed at Rs. 1907.75 today.

The price has found good support at the Fibonacci 78.6% price level (Rs. 1766.70).  

It has also found support on the 250 day moving average, with whom the price has reconnected after an entire year.


A closer look at today's chart shows a long white candle with strong volume.  Rs 1933 and Rs 1977 are the next two psychological barriers to this price. Indicators don't point to a fall in the price tomorrow and the week should end on a positive note.


Dabur Could Fall if Fibonacci Zero % breached


Dabur stock price on NSE is sideways since 3rd week of June 2010.  The price peaked at Rs 112.40 on 20th Sep 2010. 

Since then, the price has been falling slowly but steadily.  

During the price rise within the sideways, the market faced Fibonacci resistance at 61.8% (near Rs. 106).  During its return downwards, it tried to rise back but was resisted again at the same 61.8%.  Both these points are visible on the chart with blue circles.  

The stock has fallen after this resistance with quite high volume and other technical indicators also turning negative.  Moving average (not shown here) is also suggesting the stock price will make a move and the 20 day moving average has crossed the 50 day moving average just a couple of days ago.

This price is almost close to Fibonacci Zero % (Rs 96.50), and may fall further if this level is breached without support.


Cera Sanitaryware Sideways taking Fibonacci Support


Cera Sanitaryware is sideways after a quick rise in late July. 

Currently, its trading using the Fibonacci support levels.  Today's intraday low took support of the 61.8% Fibonacci and closed very near to yesterday's close.  Today's candle shows that the day ended with heavy selling pressure but relatively low volume.  

No clear signs of where the market is headed after its sideways journey.  Intra day price volatility is also very high, making it a good stock for intraday.  As I don't usually trade intraday, I'm steering clear of this choppy stock right now and will wait for clear signals to go long/short.

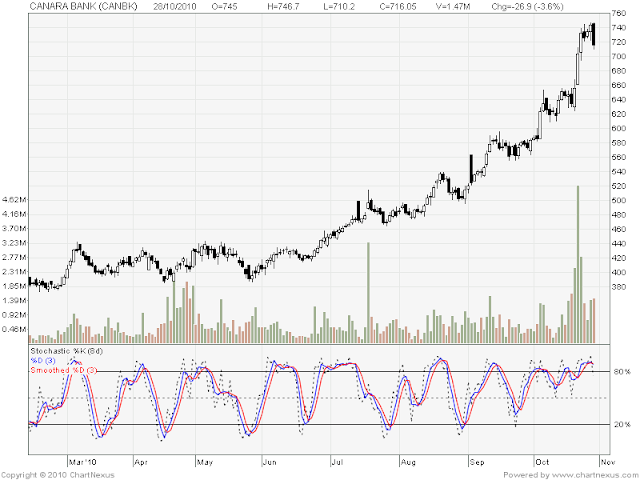
Canara Bank making Tower Top ?


Canara bank has been rising well over the last few months.  It is a good prospect for swing trading along the 50 day moving average support line.

It rose with 3 advancing soldier pattern starting 21st Oct 2010.  But after that, it consolidated for a couple of days and has formed a long black candle today.  The volume is also high.  Other indicators are also showing possibility of fall.

Is a tower top forming here?  This is a good time to wait and watch this stock.  A tower formation is bad sign!

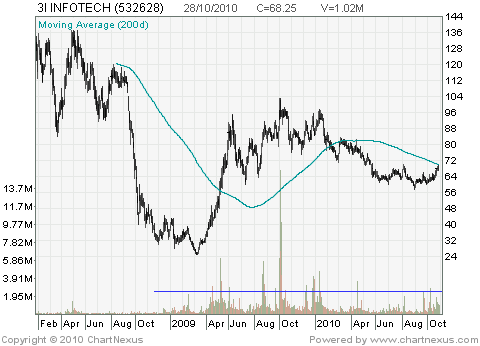
3i Infotech touches 200-day Moving Average from below


3i Infotech stock price on BSE at Rs. 68.25 has almost touched its 200-day moving average from below after falling below it in early Feb 2010.

The price did try to break through its 200-day moving average in early March, but could not achieve it.

After almost 8 months, the price has again climbed to its 200 day moving average, as is visible in today's chart.  The volume is also quite good.  If the price breaks the moving average, its a good time to go long on 3i Infotech.


Popular Posts

Connect With Me

Site Popularity

Follow Me on Twitter