3i Infotech NSE Weekly Stock Chart Technical Analysis:
People have shown great interest in looking at the 3i Infotech charts on my blog, so I'm adding a weekly analysis of this stock as well.
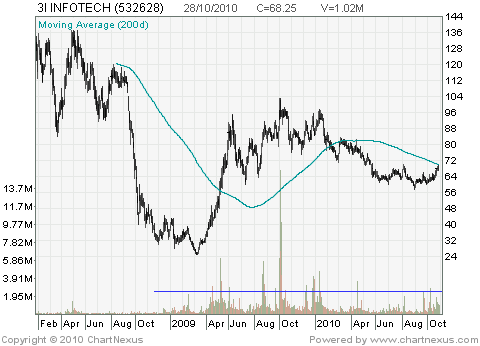
3i Infotech has formed a Doji star. After a good rise last week, this week has seen some profit booking, leading to a balanced market with neither the buyers nor the sellers in control.
The week opened at 66.9 and closed at 67.2. The intra week high and low were 70.25 and 65.2. This is less than 10% volatility and almost negligible difference between the open and close price, inspite of good volume.
Outlook for next week: The price is expected to move sideways for the coming week.
Technical Indicators:
The price finally peeked above the 50 week moving average after 6 months. This is a good sign as the stock is struggling to break its sideways trend and rise upwards.
But the appearance of a doji candlestick shows that the market is not very sure if the price should be pushed beyond the 50 week moving average. In fact, the price went beyond this line during the week but the price closed below this line. That's not too optimistic
The stock has slowed its journey towards the oversold levels. So it might soon turn downwards. Based on this indicator, the price should move sideways next week, and then fall back in the week after that. Unless of course, some big news comes in.
Talking of big news, there are rumors that Satyam Mahindra may consider buying 3i Infotech. This is unconfirmed, but if this happens, 3i Infotech could suddenly be seen soaring high above its current price level.


